Vera Kutzinski
This article focuses on the visual qualities of Alexander von Humboldt’s statistical tables in his Political Essay on the Kingdom of New Spain (1808–1811, 2nd ed. 1825–1827) with special attention to how such composites of numbers, alphabetical script, and semiotic elements relate to narrative writing. I argue that Humboldt’s tables/tableaus open up spaces inside his narrative that fragment the reading process, inviting new conversations, connections, and ideas.
Este articulo entretiene con los atributos visuales de las abundantes tablas estadísticas incluyendo en el Essai politique sur le royaume de la Nouvelle Espagne (1808–1811, 2nd ed. 1825–1827) de Alexander de Humboldt, en especial con las relaciones entre las combinaciones de números, escritura y elementos semióticos (que Humboldt llama “tableaux”) y la propia narrativa. Obran estas relaciones una fragmentación del proceso de leer, abriendo dimensiones y espacios en que se podrían manifestar nuevas conexiones, conversaciones e ideas innovadoras.
Dieser Artikel befasst sich mit den bildhaften Eigenschaften der vielen statistischen Tabellen in Alexander von Humboldts Essai politique sur le royaume de la Nouvelle Espagne (1808–1811, 2nd ed. 1820–1827), wobei meine besondere Aufmerksamkeit den Verhältnissen gilt, die diese aus Zahlen, alphabetischer Schrift und semiotischen Elementen zusammengesetzten Komposita (die Humboldt als Tableaux bezeichnet) mit der beschreibenden Erzählung selbst eingehen: In diesen Verhältnissen offenbaren sich nämlich Dimensionen oder Räumlichkeiten, die durch die visuelle Zerteilung des Textes stets weitere, neue Verbindungen, Gespräche und Ideen zu produzieren suchen.
Alexander von Humboldt’s work brims with images, from the sketches, drawings, and diagrams in his American travel diaries to the many “tableaux” and maps he incorporates in his published writings.1 Most famous among them is the “Tableau physique des Andes et Pays voisins” that accompanies the Essay on the Geography of Plants (1807). This oversize, foldout image, a landmark for biogeography and climate studies, continues to generate scholarly commentary, as do the stunning sixty-nine plates in Views of the Cordilleras and Monuments of the Indigenous Peoples of the Americas (1810).2 By contrast, Humboldt scholars have been far less intrigued by the statistical tables that abound particularly in his Political Essay on the Kingdom of New Spain (1810) and in his Political Essay on the Island of Cuba (1826).3 In part because of its length, especially in its heavily revised second edition from 1825–1827, New Spain features many more tables than Humboldt’s other writings: one hundred and seventy-seven in all.4 Some consist of no more than a few lines that almost blend in with the surrounding text; many others, however, are lengthy, layered, and complex, at times taking up several pages. Admittedly, rather than representations we can readily identify as artistic pictures, tables are images whose visual qualities pale by comparison to Humboldt’s other “tableaux” and their affinities with Naturgemälde, the nature painting in which Humboldt himself engaged on occasion and which he inspired in many others. But even if statistical tables may be about as exhilarating to literary scholars and art historians as rhetorical figures are to, say, economists, geographers, and biologists, we cannot simply ignore them.5 Humboldt’s varied statistical tables have a distinctive formal presence in New Spain. They are not just spaces filled with columns of data, that is, aesthetically insignificant repositories of empirical evidence, such as temperature measurements and population statistics. Composites of numbers, alphabetical script, and semiotic elements, tables put information before us differently than a continuous text does.6 This difference has implications for the ways in which Humboldt’s texts represent experiential, historical, and sensory data. It also affects how we read Humboldt’s writing.
To tease out these implications, I focus on the visual qualities of Humboldt’s tables in New Spain with special attention to how they relate to narrative writing. Humboldt’s tables, I argue, open spaces inside his narrative that fragment our visual field in order to invite new conversations, connections, and ideas. Humboldt’s statistical tables in New Spain can speak “both to our imagination and our spirit at the same time;” like his larger physical tableaux of the equatorial regions, such tables are quite capable of “suggesting unexpected analogies” and “could not only be of interest to those in the field of physical sciences, but could stimulate people to study [them] who do not yet know all the pleasures associated with developing our intelligence” (Jackson, 79–80).7 What I call off-road adventures tries to capture the combination of knowledge, imagination, and pleasure to which Humboldt appeals here.
Asserting that “Humboldt’s science is an aesthetic science,” Ottmar Ette explains that “Humboldt’s art of science is founded on the idea that an aesthetic dimension is precisely not added ornamention or embellishment but a compression of knowledge in which diverse forms and norms of knowledge join together and where everything, vividly and vitally, interrelates with everything else” (Ette and Maier, 13). The presence of tables in Humboldt’s texts alerts us to such an epistemological compression and marks it as part of an “art of multiconnectedness” (19). When we read Humboldt attentively, we find ourselves in an environment that Ette describes as “iconotextual.” W. J. T. Mitchell would call most of Humboldt’s texts “Image X Texts,” in which we are invited to attend to all of the possible connections between the visual and the verbal, among them “[r]upture, synthesis, relation” (Mitchell, 39). In New Spain, such varied connections often occur simultaneously. In one of the few scholarly articles on the role of statistical tables in relation to narrative, Rüdiger Campe reads Daniel Defoe’s Journal of the Plague Year (1722) as a novel that “unfolds its form solely out of the visualizing force of the tableau” (228). I want to propose that New Spain unfolds in a similar way, bearing in mind that Humboldt describes this political essay in its entirety as “tableau” (see below). Without suggesting that Defoe’s novel influenced Humboldt,8 I take Campe’s reading as a starting point for contemplating tables in relation to narrative writing. Given that Humboldt’s tables assume figural and figurative roles by virtue of being inserted into a narrative textual environment, one may well argue that the tables identify New Spain as a text written “under the auspices of the numerical diagram” (Campe, 232), even though not all of Humboldt’s diagrams are numerical.9 Humboldt’s diagrammatics may be unremarkable because he, unlike Defoe, was writing at a time when statistics as a science was no longer in its infancy and the use of tables was de rigueur in scientific writing. It is not, however, the mere presence of statistical tables in New Spain that is noteworthy but the fact that tables, not just tableaus, are an important part of Humboldt’s “practice of breaking all manifestations of simple linearity [which] also reaches across different media” (Ette and Maier, 19). Humboldt’s disdain for the conventions of linear (scientific) narrative extends from his travel diaries to his published writings. In the latter, this practice has different manifestations than it does in Humboldt’s travel diaries, where he frequently adds drawings to the handwritten text and even glues in pieces of paper. No such dis-orderly add-ons are possible in a published text, not even in revisions. In his printed works, then, Humboldt has to adopt other strategies to disrupt the linear movements in texts that, even when they are not travel narratives like his Relation historique, are still residually indebted to that genre.
Authorial intent is of course always difficult to prove, and we do not reliably know how much control Humboldt had over the precise appearance of his published texts. But, as we shall see, the ways in which he uses tables suggests patterns consonant with his other visual practices.
Roads are a notable vestige of narrative linearity in New Spain, at least a first glance. The persistence with which Humboldt turns our attention to all sorts of roads is indeed conspicuous. He includes existing roads and roads still being built or planned at the time of his visit to New Spain in 1804. In fact, entire sections of New Spain are devoted to roads (see, e.g., NE I.51–60 and IV.35–55; NS I.38–43 and II.308–17), such that roads and routes gradually emerge as figures for experiential and imagined movements. Through spatial projections in his “Reasoned Analysis of the Atlas of New Spain,” Humboldt proleptically overlays his own travel routes (as represented in this case by his “Condensed Map of the Kingdom of New Spain”) with future itineraries that are not only possible but “desirable” for filling gaps in his own knowledge. “It would be desirable for a traveler experienced in making observations to traverse the northern portion of the Kingdom of New Spain in three directions, armed with a sextant …, a time-keeper, an achromatic telescope, and a portable barometer” (NS I.19; italics added).10 Such imagined itineraries, which move in several directions at once, typically lead into territories where Humboldt himself did not tread during his visit. Given how detailed Humboldt instructions are, such future itineraries can be traced, at least in part, on the maps in the New Spain Atlas that Tobias Kraft has aptly labeled a “geography of probability” (“Wahrscheinlichkeitsgeographie,” 209–21). But more than Humboldt’s maps, his narrative is more explicitly able to chart future movements across and beyond New Spanish territory as it existed at the time of his travels. What New Spain was in 1804 had of course begun to shift after Humboldt’s departure, and it changed even more significantly during the fifteen or so years between the first and second iterations of Humboldt’s political Essai. By 1827, the Vice-Royalty of New Spain was no longer a Spanish colony but had been the federated republic of Mexico since 1824. In fact, given that the challenges to Spanish colonial rule date back at least to 1808, precisely the time during which Humboldt was busy working on the first version of New Spain, it would be most accurate to say that the political ground had been shifting under his feet all along.
Actual roads and probable routes intertwine in Humboldt’s writing, making travel always oscillate between the materiality of roads and the imaginary dimension of routes. There may be only one road that directly connected Acapulco and Mexico City at the time, but there are any number of different routes one might plot that also lead from one city to the other. One might say, then, that the noun routes (a cognate in English and French) emphasizes the imaginative dimension Humboldt attaches to roads. It is, however, less important to separate the material from the imaginary aspects of travel than to acknowledge that one does not exist without the other: roads almost always spawn alternate routes. Humboldt signals this interplay – roads-routes – in his New Spain index by including different entries for roads (chemins), routes (routes), and streets (chausées). The entry “Chemins. Voyez Routes,” for instance (NE IV.337) points us to two other brief entries: “Routes les plus fréquentées par le commerce, IV.34. Leurs divisions en longitudinales et transversales, 35. Description de celle de Mexico à Acapulco; de celle de Mexico à la Vera-Cruz, 39,” and right above it, “Route de Philadelphie à Mexico, II.225, note. De Pueblo Viego à Mexico, 364. Détails sur cette route et sur les points par où elle passe, ibid. Sa commodité, ibid.” (NE IV.363). Neither entry, however, reflects the frequency with which the nouns “chemin” and “route” appear in New Spain – 154 and 205 times, respectively. Although this rate may well surpass the ability, and patience, of any indexer, even one as focused on detail as Humboldt is, the fact remains that the entry for “Chemins” does not lead back into the text and that the index entry to which it refers does so only very limitedly. What the index creates, then, is a largely self-referential circularity that sums up what roads-routes represent throughout Humboldt’s text. Together, they form an intricate web that encodes in the text different ways of moving and movements in more than one direction and/or dimension. Tables, as we shall see, are loosely attached to this web. They define points at which the (seemingly linear) narrative pauses to invite detours into temporalities other than the present moment and into geographies other than that of New Spain. Each table, no matter how small, is a visual gateway that temporarily arrests and then redirects the flow of the narrative. Humboldt’s tables alert us to the possibilities to off-road movements that render his text increasingly multidimensional – and global.
While roads are clearly part of an infrastructure vital to trade, one of Humboldt’s major concerns in New Spain, there are yet other reasons why he mentions roads and routes with such frequency and discusses them at such length. On the one hand, roads, routes, trails, pathways, and itineraries are vestiges of linearity. On the other hand, however, their sinuosity exceeds linearity. To measure roads, then, is by necessity an attempt at describing “irregular and fragmented patterns” (Kutzinski and Ette, xx). Humboldt’s account of traveling on “The Road from Pueblo Viejo to Mexico City” is a case in point. Distances, we quickly come to understand, are not absolute, because humans, in this case mule drivers, do not travel “as the crow flies”:
The distance from Mexico City to Pueblo Viejo de Tampico as the crow flies is, according to my general Map of New Spain (1804) which Mr. Bauzá will soon replace with another more precise map, sixty nautical leagues (at 2,854 toises). Adding one-quarter to compensate for the twisting roads, one finds that each of the mule-drivers’ 111 leagues equals 1,928 toises. (NS I.501–2; italics added)11
Humboldt even supplies a small table that compares distances between several cities, as the crow flies and inclusive of mule drivers’ detours “measured at one-quarter more than the direct distance” (“comptés à ½ de la distance directe,” NE II.366).12
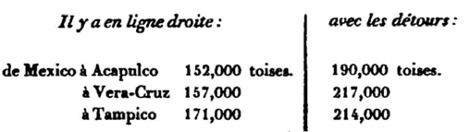
This table functions in the printed text as if it were a “way station” (station), perhaps even a scenic outlook. While a way station is typically a resting place, it can also be a figure for brief stopovers and even lengthier detours. In the four-page “tableau” in which this small table is embedded, way stations are “marked with an asterisk” (“les stations marquées d’un astérisque,” NE II.366). Humboldt also supplies the distance that connects one to the next, as in “[Rancho] de Vichin* fifteen mule-driver leagues” and “Hacienda de Río Grande* twelve leagues,” making each way station part of a larger network. To say that each of Humboldt’s tables functions as a way station of sorts is also to suggest that these “graphics of text-embedded numbers and the images of number series …, by challenging the beholder’s view, demand further reading” (Campe, 220, italics added). In New Spain, and in Humboldt’s writings more broadly, the process of reading further is always also a process of reading farther.13 The small table above is a visual cue for readers to stop, not, as in the case of the mule drivers, to spend part of the night and feed their animals, but to stop following the path of the written narrative. The table is an invitation to look, specifically to contemplate the view across the southern portion of New Spain, from Mexico City to the west-coast port of Acapulco, where Humboldt had arrived, and then back to the ports of Tampico and Veracruz on the southeastern coastline of the Gulf of Mexico, whence Humboldt would depart. Ideally, we would stop for long enough to supplement our mental images with a look at Humboldt’s maps in the accompanying Atlas. Additionally, we may call up the digitized images from the David Rumsey Map Collection that allow us to follow the roads in a different visual medium. Included among the maps in the Atlas are two drawings (“tableaux”) of the roads from Mexico City to Veracruz and to Acapulco, in which Humboldt used his own barometric and trigonometric measurements to draw elevation profiles (Figures 1a and 1b). These cross-sections of the physical terrain of the southern parts of New Spain complement the distance measurements from the above table with more precise visual information. Here, we can see elevations, not just imagine them. Both tableaux translate the numbers Humboldt derives from his own measurements into line graphs. Then, by filling the spaces between the graphs and the horizontal axes with hachures on an earthen colored background to suggest geological formations, he transforms them into pictures that resemble landscape paintings.
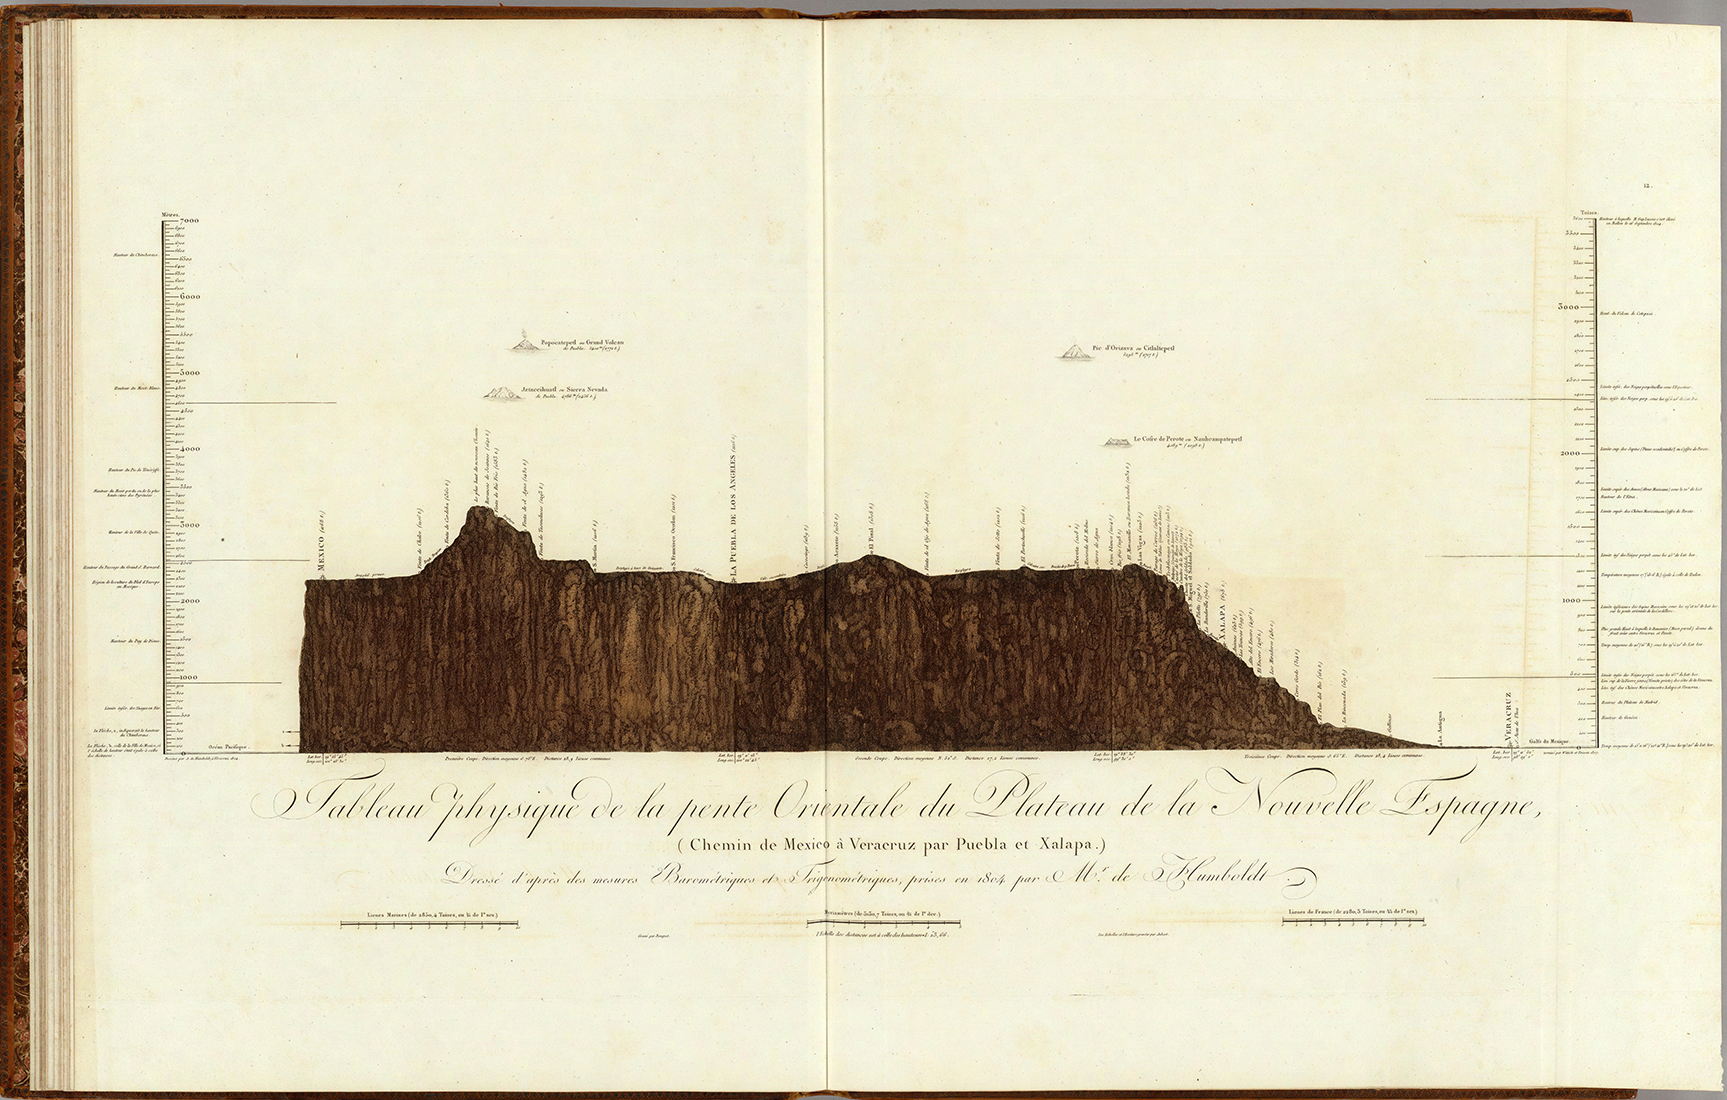
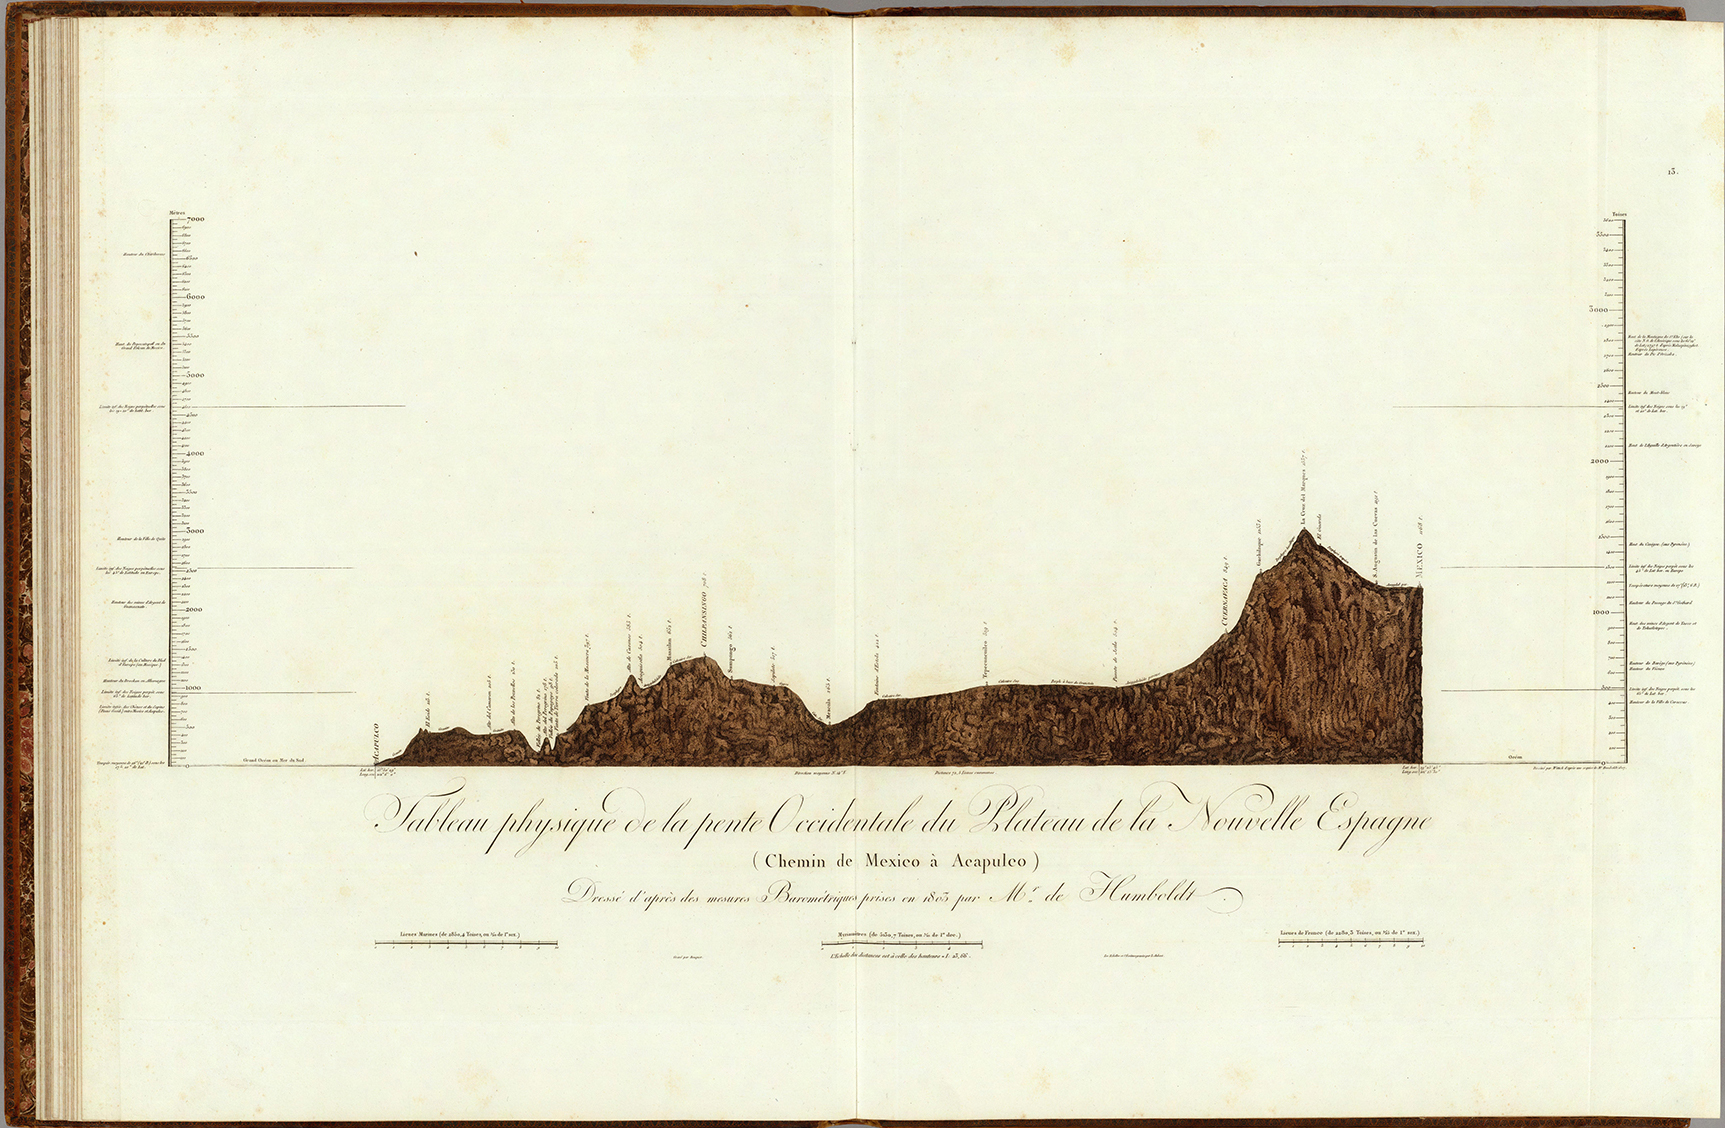
Figures 1a and 1b: “Tableau physique de la pente orientale du Plateau de la Nouvelle Espagne (Chemin de Mexico à Acapulco)” and “Tableau physique de la pente occidentale du Plateau de la Nouvelle Espagne (Chemin de Mexico à Acapulco),” Numbers XII and XIII in Humboldt’s Atlas. Courtesy: David Rumsey Collection of Maps.
We should not let the beauty of these pictures distract us from the fact that these are imaginary landscapes generated entirely by Humboldt’s elevation measurements and of what he could glean of geological compositions from the surface. The same is true of the drawings in Figures 2 and 3 below. Nobody at any point in time can actually behold a view that would resemble these abstractions because they are profiles that render visible the invisible below the surface of the earth. What makes these representations resemble natural landscapes is the almost three-dimensional solidity achieved by the coloring, combined with the hachures, a convention Humboldt imports from his topographic maps. In other words, Humboldt tableaus do not resemble anything outside of themselves that would be visible to the eye. They are not mimetic representations but mathematical abstractions that Humboldt supplements artistically.
Not everything we see in the above images is below ground. Figure 1a also includes four tiny iconic drawings of volcanoes hovering in the space above the graph. These drawings, which function as visual portals in their own right, emblematize the presence of additional vectors that lead back into the text of New Spain to the “Picturesque View of the Volcanoes of Mexico City and Puebla” (NE I.161f.) and to Views of the Cordilleras (Plate X, Cotopaxi). In Views, Humboldt offers larger versions of his miniatures of Popocatépetl, Iztaccíhuatl, Pico de Orizaba, and Cofre de Perote. Comparing the two versions lends visual emphasis to Humboldt’s experiments with scaling up and down throughout his writings, often quite rapidly. That he also uses a variety of distance scales, here placed at the bottom of each tableau, further emphasizes his resistance to standardization. The small drawings suggest yet another direction in which to continue our off-road journey, now even further back in time to Humboldt’s American travel journals, digital scans of which are available at the Humboldt Portal of the Berlin State Library. To locate related visual material, it might be helpful first to consult the voluminous collection of The Complete Drawings from the American Travel Diaries. Among the many landscape profiles this collection includes, we readily encounter (at least) two that qualify as visual precursors for his elevation profiles in Figures 1a and 1b. Humboldt most likely began with the small sketch in the upper left-hand margin of one of his diary pages (Figure 2), which he could have easily drawn while on the road, and then moved on to create a more detailed image. Figure 3 takes up an entire page in landscape format (rotated below) to deepen the surface evidence of the different geological strata while traveling, as Humboldt did, from Acapulco to Mexico City.
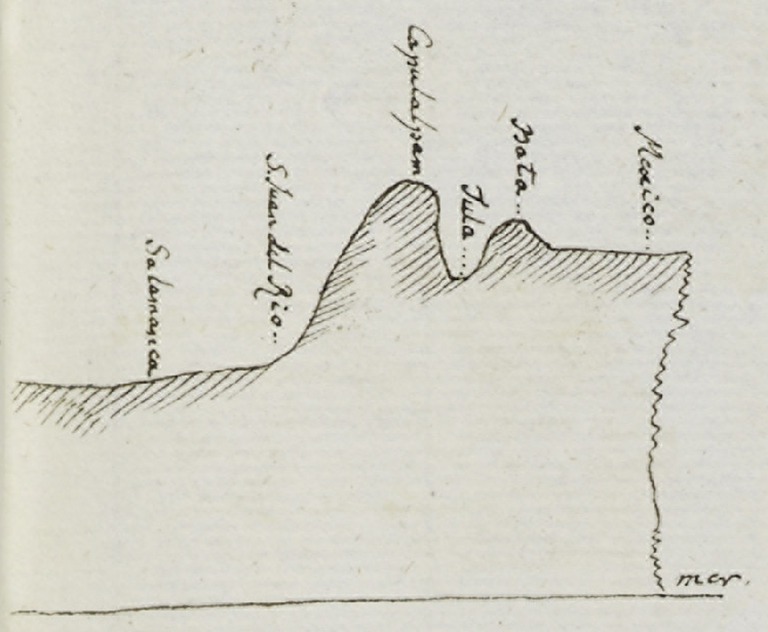
Figure 2: Partial of “Landscape profile of the high plains of the Viceroyalty of New Spain from the Atlantic Ocean to Mexico City and to Salamanca, August 1803.” Ink on paper, 331 × 203 mm, Diary IX, p. 57, 29 r. (Ette and Maier, 421). Online at https://digital.staatsbibliothek-berlin.de/werkansicht?PPN=PPN779884841&PHYSID=PHYS_0045&view=overview-toc&DMDID=DMDLOG_0001 (accessed 10/03/23).
As I mentioned above, Humboldt describes the whole of New Spain as a tableau, specifically, a “tableau politique” (NE IV.160). Rendering this phrase in English as “political panorama” (NS II.390) allows for a greater emphasis on movement than the older French noun tableau. The concept of the panorama clarifies the extent to which Humboldt’s attempts at achieving full impressions depended on the idea of creating a text-in-motion. In its coinage by Irish-born Scottish artist Robert Barker in the 1780s, the noun panorama refers to a painting-in-motion that creates the illusion of a full view by laying out a sequence or series of views initially on a revolving cylindrical surface, then on the walls of a circular building with a viewing platform in its center.14 The latter installations displaced movement from the much smaller cylindrical apparatus to the viewer, who had to make a slow 360 degree turn for the effect to work.15 Given the popularity of panoramas in early nineteenth-century Europe, Humboldt would no doubt have been familiar with such virtual reality effects. However, unlike the panoramic views of cities and battle sites that Barker and others created, Humboldt’s above profiles, unlike some of his drawings below, do not rely on mimetic realism, even as their sprawling layout is evocative of a panorama in that it seeks to convey a complete or entire view. Indeed, by 1801, the word panorama had acquired precisely that meaning, so that Humboldt’s idea of the “full” or total (visual) impression he wanted to convey in his work would have been familiar to his contemporary readers.16
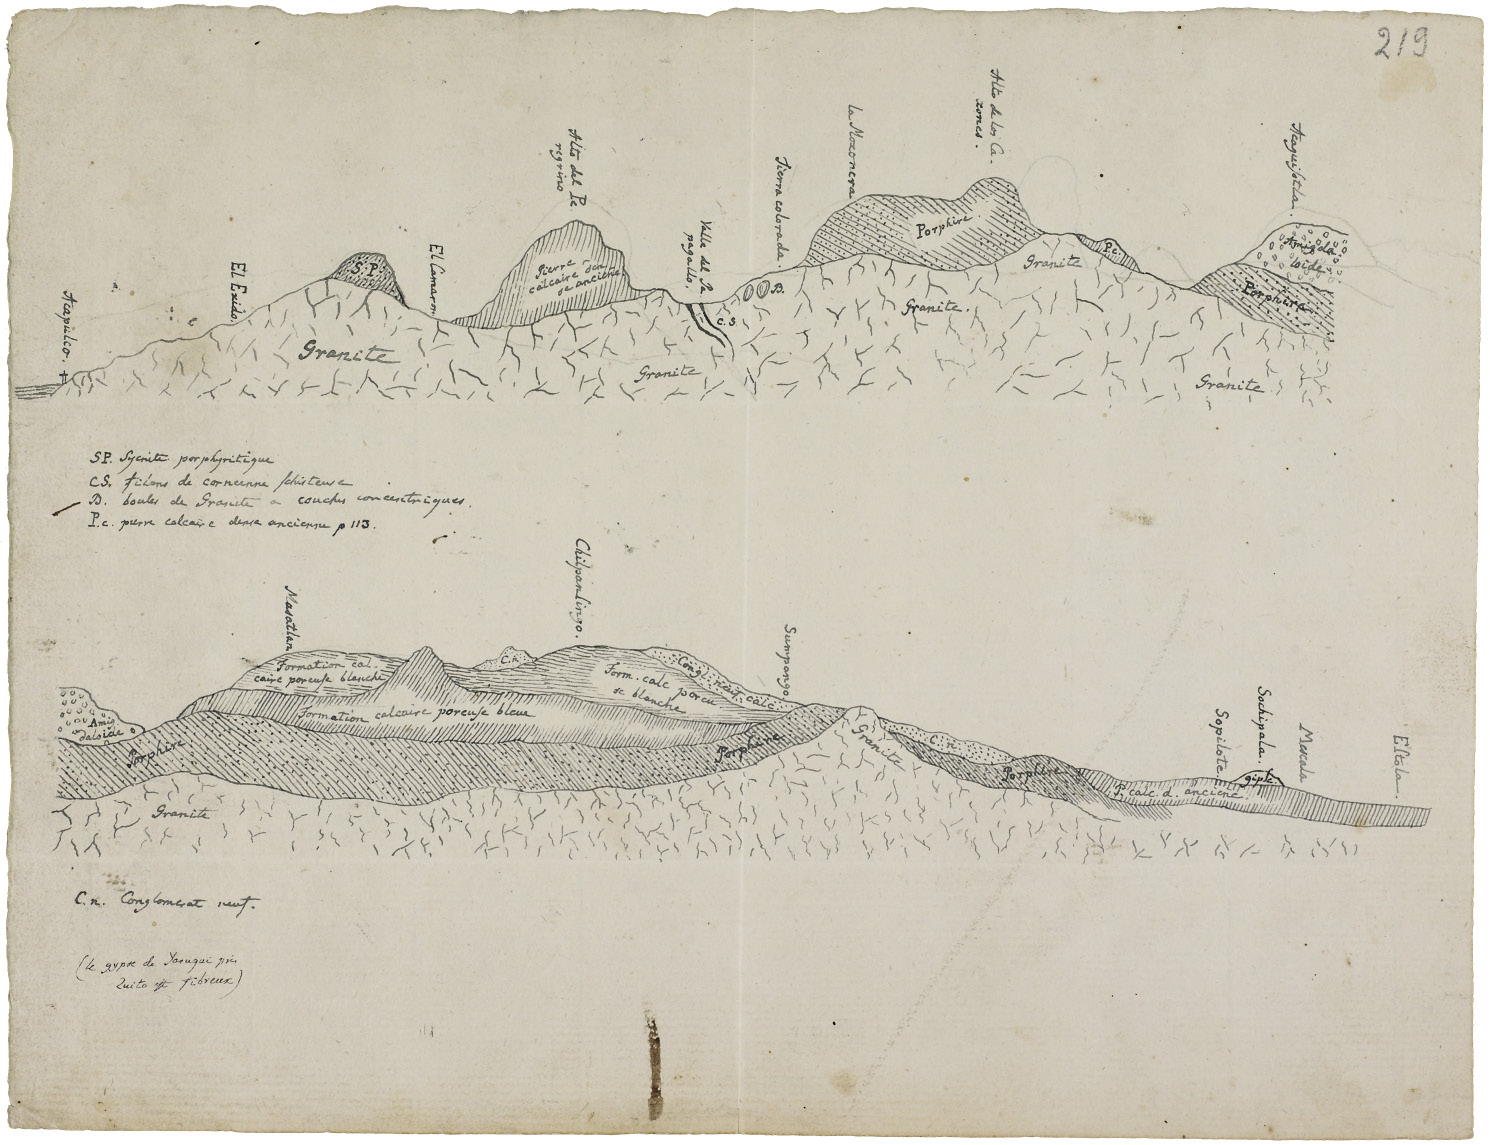
Figure 3: “Geognostic profile of the route from Acapulco to Mexico City, 1803.” Ink and pencil on paper, 196 × 256 mm, Diary VIII, 219 r. (Ette and Maier, 447). Online at https://digital.staatsbibliothek-berlin.de/werkansicht?PPN=PPN779884590&PHYSID=PHYS_0425&view=overview-toc&DMDID=DMDLOG_0001 (accessed 10/03/23).
Beyond its connections to landscape painting, Humboldt’s “political panorama” has conceptual roots in cameralistics, the science of public revenue and finance with which Humboldt was intimately familiar from his studies in Frankfurt (Oder), Göttingen, and Hamburg and subsequently his work in the bureaucracy of the Prussian mining administrations and inspection (see Dettelbach; Klein). Those quantitative systems did not, however, allow for excursions into other disciplines such as geography and geology. Tobias Kraft’s point that cameralistics, as a single disciplinary orientation, provides a starting point for Humboldt but quickly proves insufficient for creating an adequate picture of New Spain’s situation, is well taken (257). But Kraft does not explore how this insufficiency translates into aesthetics. That Humboldt adds painterly qualities to his above elevation profiles shows that he values beauty as much as he does scientific facts, which he already emphasizes in the “Reasoned Analysis” that prefaces the political essay proper. “Although the goal of this work is to describe the territorial wealth rather than the geological composition of New Spain,” Humboldt writes, “I felt I should append some picturesque views (Numbers XVI and XVII) to the Mexican atlas as a supplement to the map of the valley (plate III) and to give a better impression of the beauty of Mexico City’s setting” (NS I.110; italics added).17 Humboldt announces rather gleefully that he cannot capture the beauty of the landscape unless he exceeds cameralistic frames. He makes the same point visually in one of his elevation profiles by adding profiles of the small drawings of volcanoes (Figure 1a). Two larger versions of them reappear in his Atlas as “picturesque views” that immediately follow the elevation profiles (Figures 4a and 5a). Given the trajectory of my readings above, it seems inevitable that those images, small and large, lead to Humboldt’s American travel diaries. This particular excursion bring us face to face with several related drawings through which we can trace the beginnings of the visual material Humboldt included in his New Spain Atlas even more precisely than with the elevation profiles (Figures 4b, 4c, and 5b).
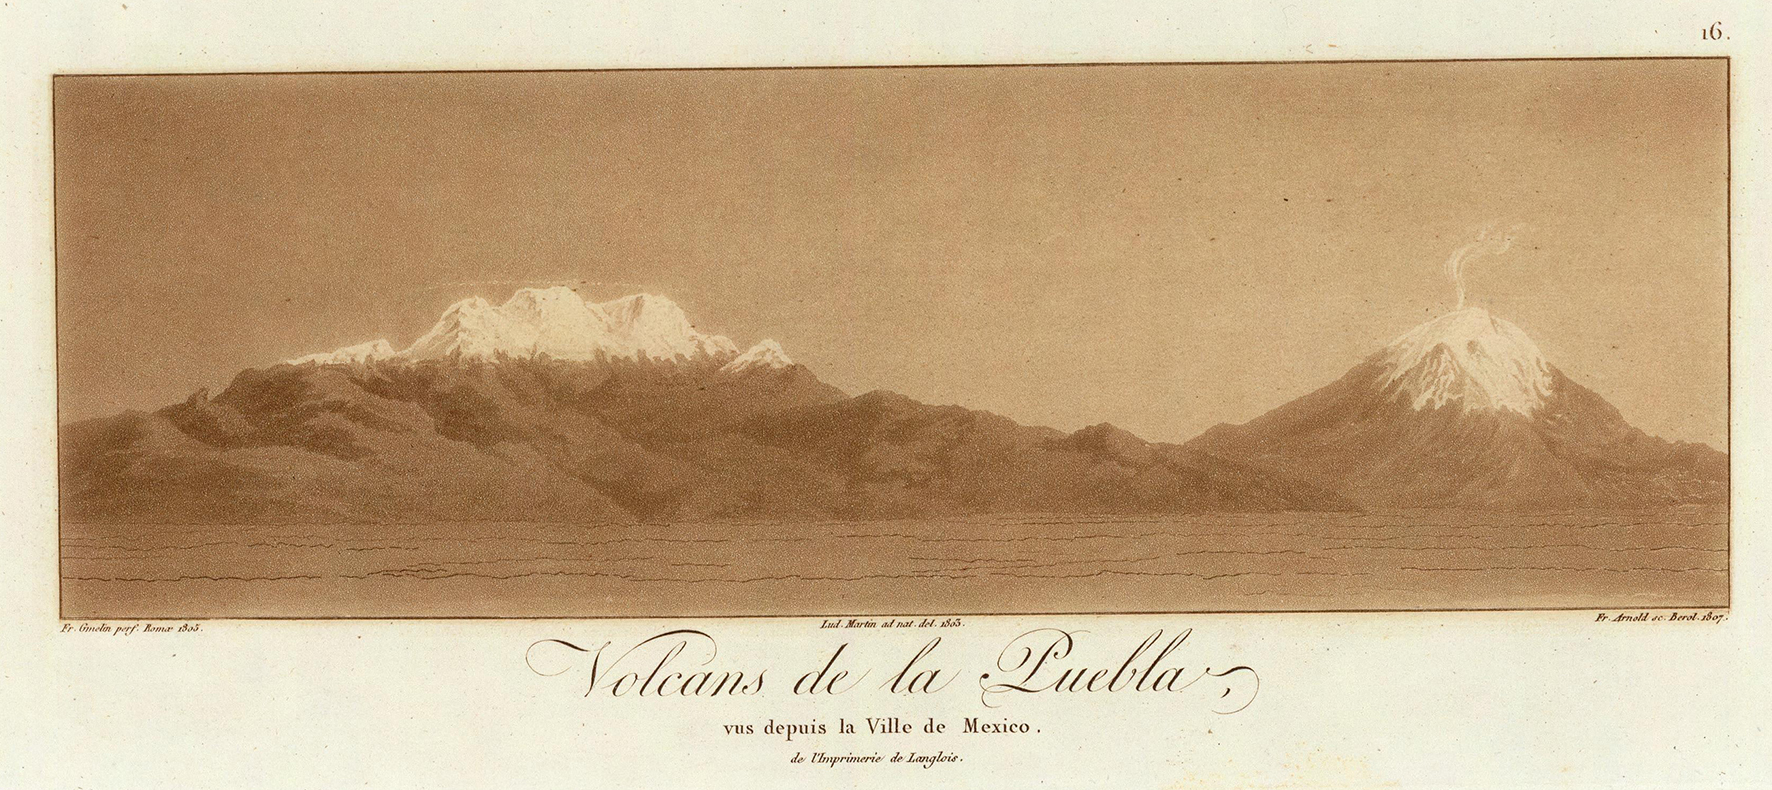
Figure 4a: “Volcans de la Puebla, vus depuis la Ville de Mexico” (1803). # XV in Humboldt’s Atlas. Courtesy David Rumsey Collection of Maps.
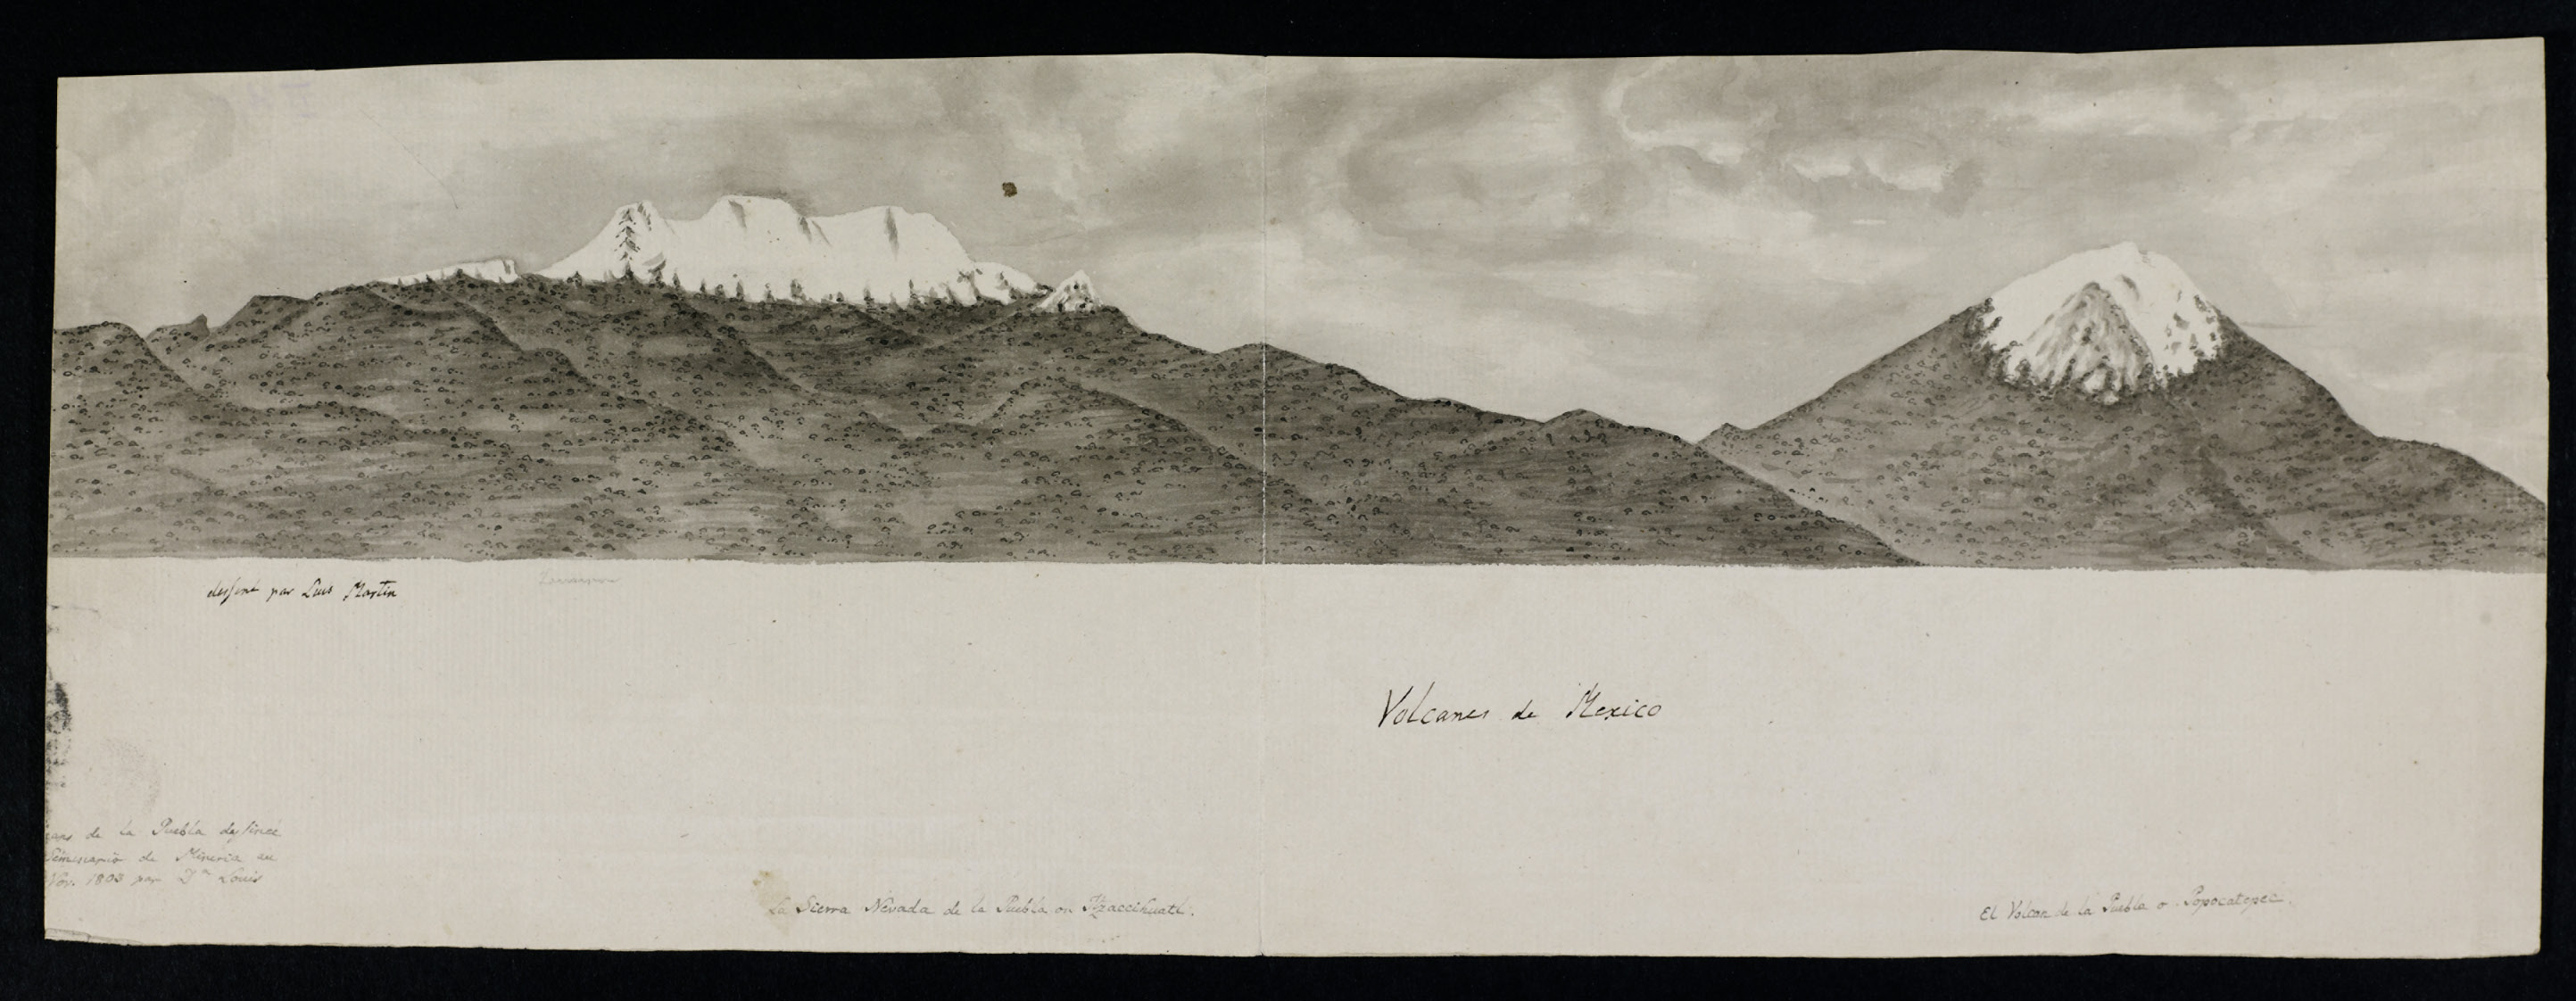
Figure 4b: “Drawing related to the volcanoes of Mexico by Luis Martin, November 1803.” Ink and pencil on paper, 179 × 486 mm, Diary VII bb & VIIc, 411 v. (Ette and Maier, 344–45). Online at https://digital.staatsbibliothek-berlin.de/werkansicht?PPN=PPN779884310&PHYSID=PHYS_0804&view=overview-toc&DMDID=DMDLOG_0001 (accessed 10/03/23).
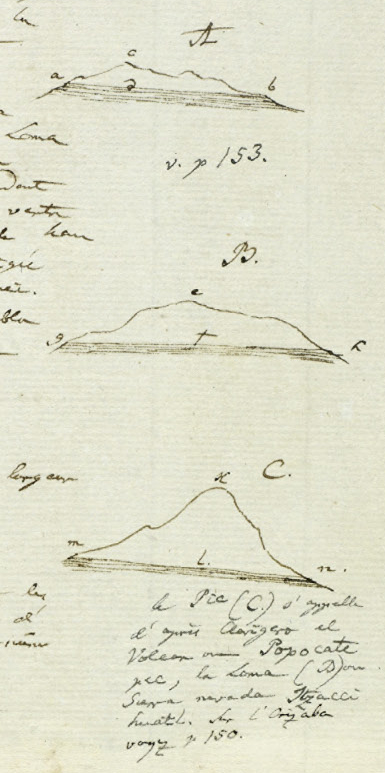
Figure 4c: “Views of the volcanoes Popocatépetl (C) and Iztaccíhuatl (B), as well as an angle measurement of the Nevado de Toluca, November 1803.” Ink on paper, 335 × 203 mm, Diary VIII, p. 118, 60 v. (Ette and Maier, 359). Online at https://digital.staatsbibliothek-berlin.de/werkansicht?PPN=PPN779884590&PHYSID=PHYS_0299&view=overview-toc&DMDID=DMDLOG_0001 (accessed 10/03/23).
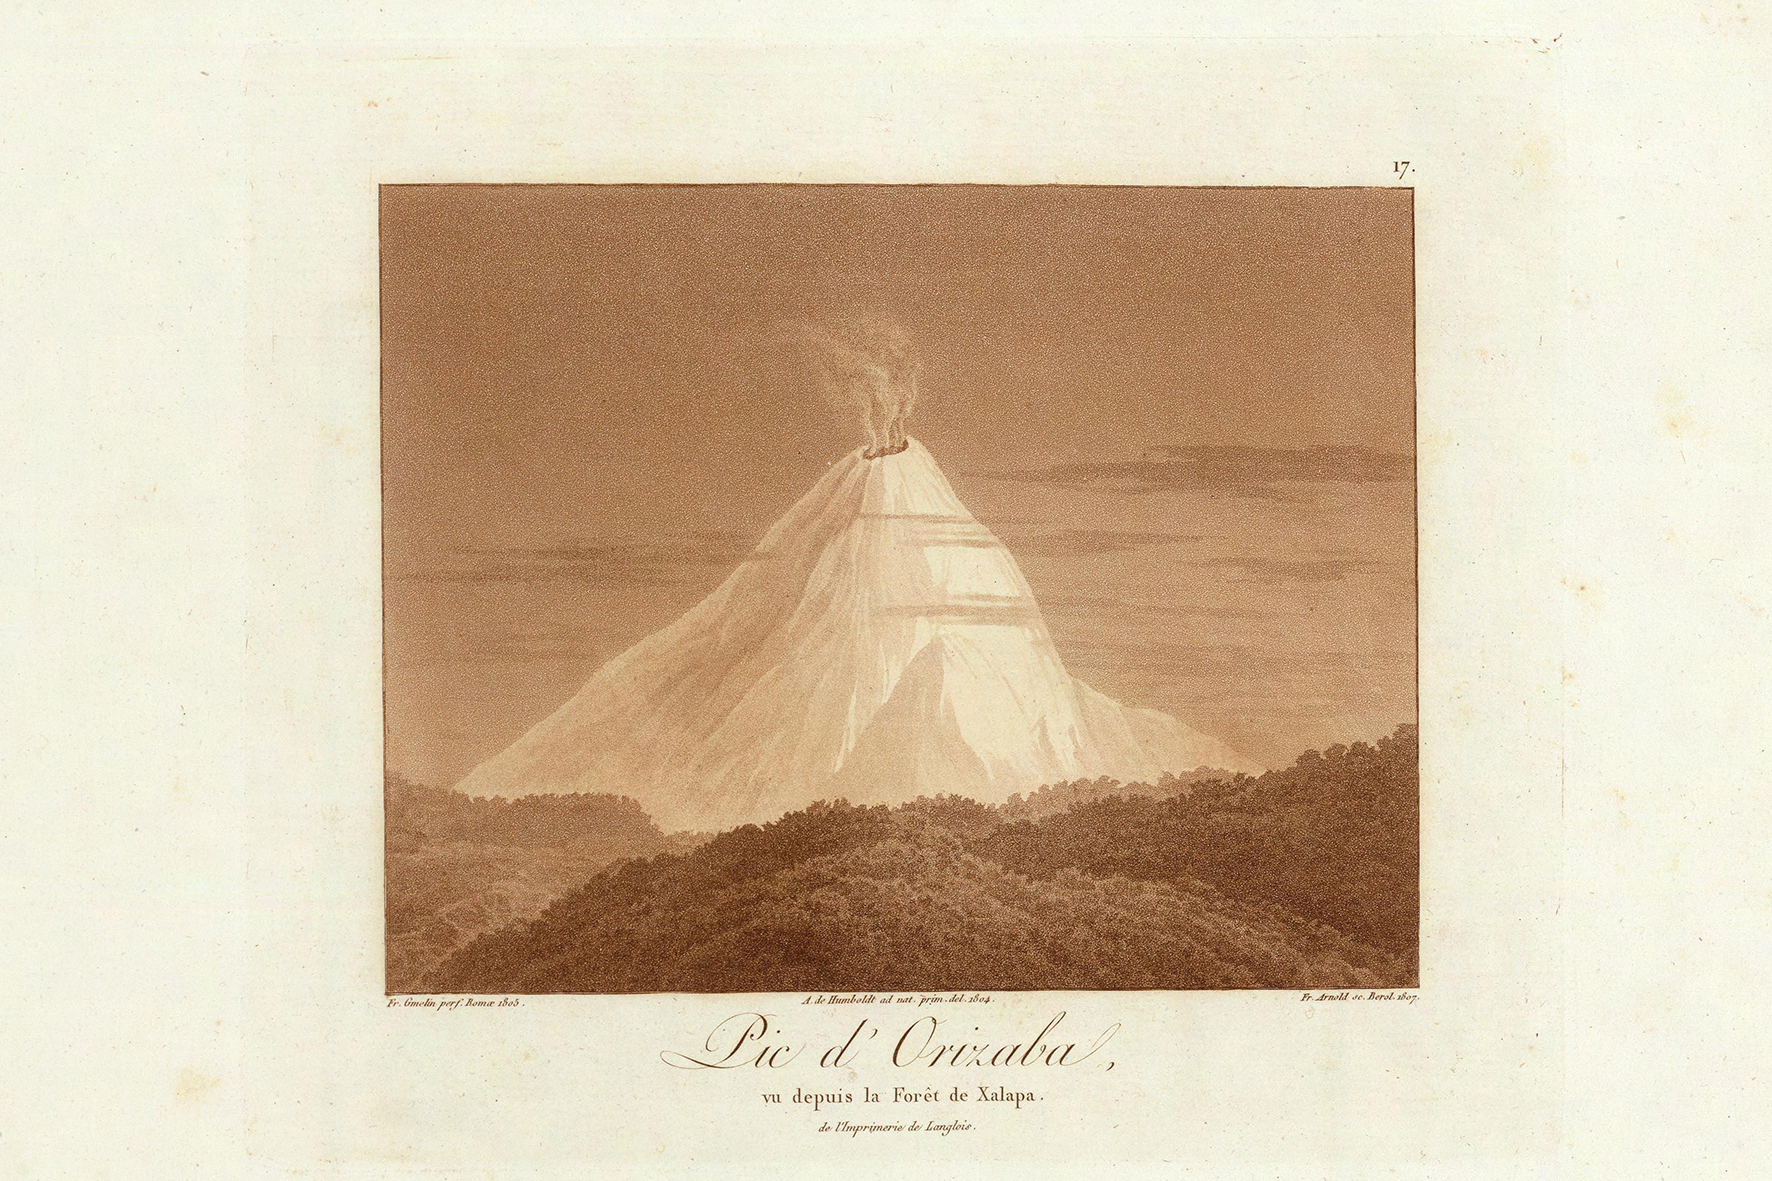
Figures 5a: “Pic d’Orizaba vu depuis la Forêt de Xalapa” (1804). #XVII in Humboldt’s Atlas. Courtesy David Rumsey Collection of Maps.
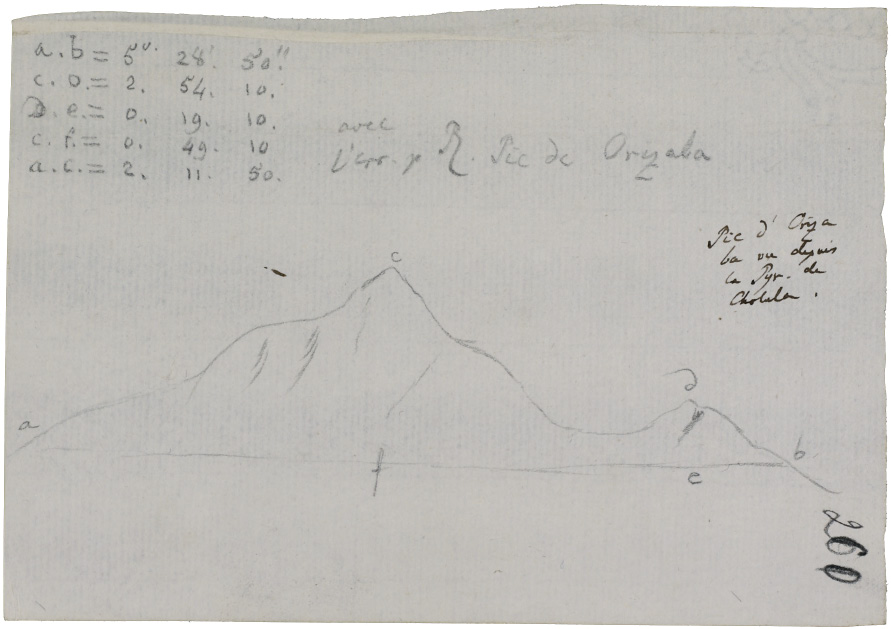
Figure 5b: “View of the peak of the Orizaba (b.m.) from the Pyramid of Cholula,” January 1804. Pencil on paper, 153 × 108 mm, Diary VII a & VII b, 260 r. (Ette and Maier, 333). Online at https://digital.staatsbibliothek-berlin.de/werkansicht?PPN=PPN779883861&PHYSID=PHYS_0521&DMDID=DMDLOG_0001 (accessed 10/3/23).
One shape stands out even in a cursory inspection of the drawings in Humboldt’s American travel diaries: mountains. In fact, an entire section of the Complete Drawings is devoted to “Views of Coastlines, Mountains, and Volcanoes” (322f.), and the section on “Profiles of Landscapes and Elevations” (364f.) adds a plethora of more abstract sketches of slopes to make for a sizeable inventory of such forms. Mountains are everywhere in Humboldt’s work, most especially the volcanoes he encountered in Ecuador, Peru, and, of course, Mexico. Volcanoes held a special fascination for Humboldt, and he drew them with a passion bordering on obsession. It was hardly a coincidence that he began his American travels with climbing and measuring volcanic slopes during a stopover in the Canary Islands. Nor is it a coincidence that the two images Humboldt singles out in New Spain when he articulates his desire to give “a better impression of the beauty of Mexico City’s setting” are of volcanoes. Unsurprisingly, then, the shape of volcanic slopes in Humboldt’s many drawings, be they abstract or more mimetic, is a key component of the visual literacy we acquire when we read New Spain and Humboldt’s other writings on the Americas.18 This visual literacy depends crucially on recognizing shapes repeated frequently enough to form patterns in which knowledge combines with beauty. We encounter such shapes at unexpected moments in New Spain, most notably in some of Humboldt’s tables on seemingly unrelated matters (Figure 6).
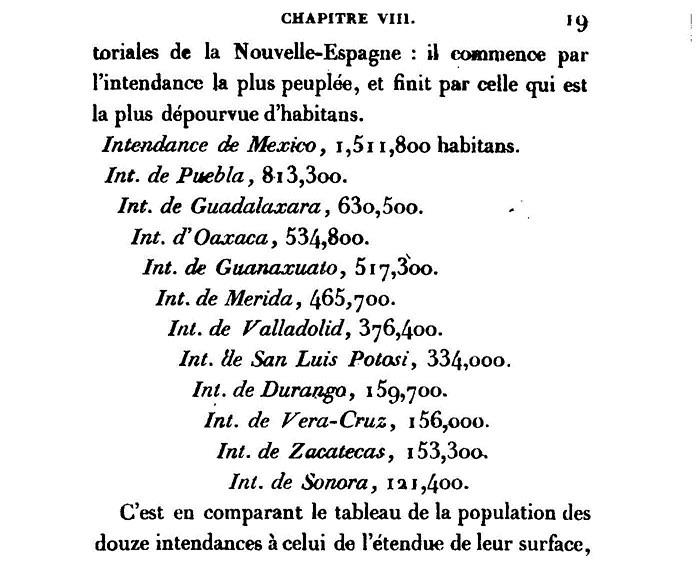
Figure 6: Population statistic (NE II.19).
It would not be too fanciful to suggest that the descent in this table from the most to the least populous intendancies of New Spain re-creates the shape of a mountain slope. This is one of three similarly shaped tables in a section devoted to a lengthy “Analyse Statistique du Royaume de la Nouvelle Espagne” in which Humboldt combines territory size with census numbers. While he does not dwell on the relation of population density to physical terrain, the shape of his tables already implies such a connection. In the midst of a comparative statistical analysis that ranges from France to Russia, these tables are visual reminders of the location(s) at the center of the comparison. Their sloping shape recalls visually what stands out to Humboldt as the most beautiful parts of the New Spanish landscape: views of volcanoes.
While Humboldt’s numerous tables in New Spain are way stations or portals at which the narrative pauses to make us aware of the kinds of off-road hermeneutical possibilities I have pursued in my reading of an inconspicuous table about roads, not all tables function in quite the same way, even if each of them, to a greater or lesser extent, produces vectors into other dimensions, be they historical, geographical, or (inter)disciplinary. Nor do all of Humboldt’s tables in New Spain look alike. For Humboldt to combine epistemology with aesthetics, it is important that the tables he embeds in his narrative differ in their visual appearance and thus in their relation to the surrounding text. The effect tables produce throughout New Spain is to fragment readers’ visual field, challenging them to resist the pull of the narrative and swerve into other forms of order. Creating a structure of variety accomplishes this far more effectively than similarity. While variety still enables us to recognize recurring shapes and patterns, it does not allow us to settle down into a single system of epistemic organization. The table in Figure 7, for instance, one of many like it from a chapter that focuses on mining and the international trade in precious metals, notably conforms to the rigid system of ordering a statistical data collection, something at which the table in Figure 1 above only hints due to its smallness. Because statistics eschew semantic expression and minimize the use of alphabetical script, the table’s lines and vertical columns of numbers clash in their appearance with the surrounding narrative. The double-lined frame reinforces that visual separation. Because there is no question here where one system of representation ends and the other begins, I have omitted the surrounding text from my reproduction of this table.
In addition to transporting us beyond New Spain and into the geography of the Viceroyalty of Peru, where Humboldt traveled in 1802, this table compresses 29 years of historical data into a relatively small space.19 The table breaks down the combined yield of three Peruvian silver mines into numbers of ingots, along with their weight and monetary value in piasters, measured by the amount of taxes paid on that value. The absence of gridlines increases the visibility of the sharp rise and fall in production (in columns C and E), on which Humboldt comments earlier in the chapter. The separation of table from text is not, however, entirely visual. The text immediately preceding the table sets up a disagreement between table and narrative that we might not notice unless we read the numbers in the table and the text carefully. The 29-year total Humboldt gives in the text is oddly lower than the one the table supplies. “From April 1774 to October 1802, the mines of Gualgayoc, in the partido of Chota, together furnished the provincial coffers of Trujillo with a total of 1,912,327 marks of silver, or, in an average year, 67,193 marks” (NS II.203).20 The difference of 231,852 is considerable enough to make us pause long enough to realize that this is not an error but that Humboldt has suddenly switched from piasters to silver marks. The variance produced by the shift from one system of measurement to another alerts us to the at times dizzying simultaneity of a wide range of different units of weight and measure in New Spain. This practice, on which Humboldt rarely comments, reflects the global dimensions of his thinking, dimensions that make it further undesirable to standardize. He does not convert piasters into marks any more than he translates “lieux marines” into myriameters into “lieux de France” in the three scales at the bottom of Figures 1a and 1b, where he only offers visual equivalents. This practice is a small but telling aspect of the refusal to reduce everything to a single system, which pervades his entire work.
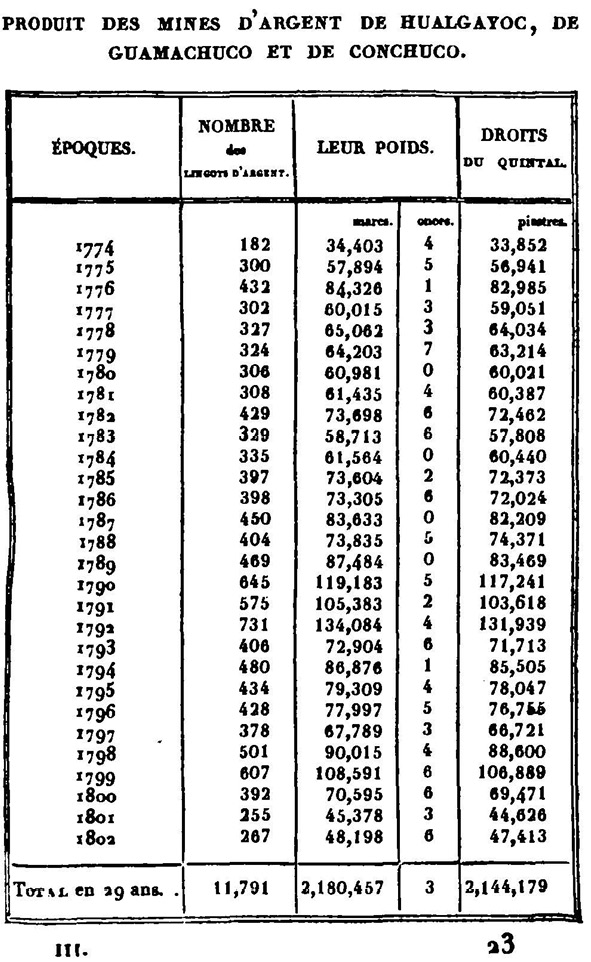
Figure 7: Statistical table (NE III.353).
In his reading of the Tablas geográfico políticas del Reino de Nueva España, which Humboldt completed for the New Spanish Viceroy José de Iturrigaray in 1803 while he was still on location, Tobias Kraft shows how Humboldt “literally and figuratively [writes] across the formal systems” of statistical data collection (256). The following image of a page from New Spain is a good example of how Humboldt’s writing-across erases the boundary between table and narrative, making one bleed into the other.
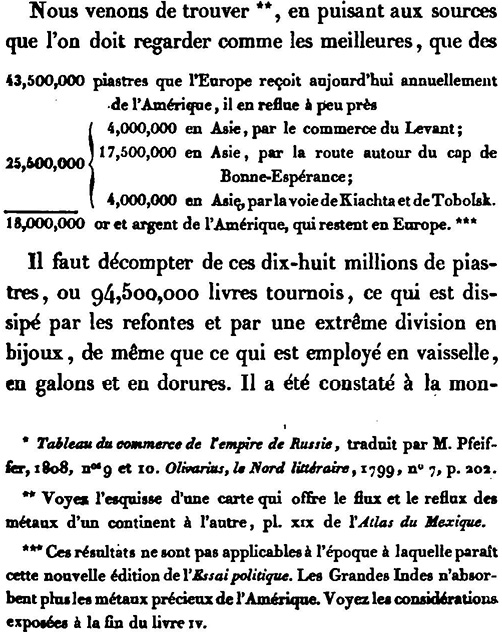
Figure 8: Table or tableau? (NE III.443).
Grammatically a continuation of the preceding sentence, this table shows how Humboldt changes systems of representation in mid-stream, so to speak. He freely writes across the text-image divide that, because of the absence of a visual frame, is virtually invisible here. If it were not for the smaller font, we would barely recognize this table as a separate space that is, in fact, a space of transformation.21 This particular hybrid table differs from my other examples not only visually but also because it compares European, Asian, and American situations, in this case through their trade in precious metals. This table is a useful example of a portal that encourages us to read not just further (that is within a New Spanish context) but also farther, beyond even the Americas and into transatlantic and transpacific political and economic geographies. Of the numerous hybrid tables in New Spain, this one is among the most compact. Most other visual exhibits of Humboldt’s crosswriting are far more sprawling. In some cases, the situation is the reverse of what we see in Figure 8. When Humboldt analyzes the Veracruz commodity trade, for example, he represents the numbers for 1804 as a table that resembles the one above in its compactness (NE IV.79). But where we would have expected another, larger table to break down the details of imports and exports, we instead encounter a fast-moving narrative that runs on for several pages as Humboldt lists the numbers for subsequent years of trade. For 1805 and 1806 (NE IV.81f), only the italicized subtitles – “Commerce de Vera-Cruz …” – visually echo the initial table format. Humboldt uses several smaller tables in this section to show paper imports for several years and to compare import-export activities in Veracruz and Alvarado. But he reserves a more encompassing table about international trade activities for a large foldout table whose appearance dead-stops the narrative progression. It is as if the rapid-fire narrative, in which words tumble over numbers, has built up speed precisely to prepare for and culminate in this visual crescendo of a table far too large to quote here (see NE IV.85).
I close with a confession and a brief study in contrasts. Until I corrected page proofs for the volumes in the series of new English-language translations that the Alexander von Humboldt in English (HiE) project published between 2011 and 2019, even I gave little thought to Humboldt’s tables in relation to his narrative. What caught my attention was that the book designers at the University of Chicago Press tended to treat all tables as if they were illustrations, as if it did not matter where they appeared. The explanation why the designers had ignored most callouts indicating the precise location of tables was that they, unlike copyeditors, do not read the text when making decisions about where to place an image. Instead, designers are more concerned with visual “fit” on a given page rather than with iconotextual relations. As a result, there were many instances, especially in the two political Essays, where production practices created moments of utter incoherence in Humboldt’s text.22 But there is something else about the way in which tables are rendered in these translations that my above discussion makes worth addressing: Even if almost all the tables are now positioned correctly in print, they still look very different in the translation. To show how different, and what a difference that visual dissimilarity makes, I use my above examples from New Spain. Consider, for instance, that in the translation the large foldout table I did not replicate (NE IV.85) is now no longer a foldout but instead, even though it largely remains in portrait format, extends across several pages (NS II.342–47). Because what Humboldt clearly wanted to capture on a single large sheet has been broken up, it is almost impossible to read horizontally across the many columns that now appear on subsequent pages. That the last few columns of this table appear in landscape format adds to this difficulty by making it seem as if this were a separate table altogether. In other words, the full impression Humboldt wanted to create of the changes in the Veracruz trade balances across a twenty-five-year period (1796–1820) is lost to such an extent that readers have little choice but to consult the second edition of Nouvelle Espagne to get their visual bearings. A similar transformation occurs in the case of the table from Figure 7, which I repeat here to show the contrast. Although laid out in landscape format across two pages in the translation, the visual effect of this table is not remotely as jarring here as it is with Humboldt’s other foldouts:
The translation also does not carry over the visual variety from the tables in Nouvelle Espagne, as we can see when we compare the table from Figure 10a with its English version in Figure 10b.
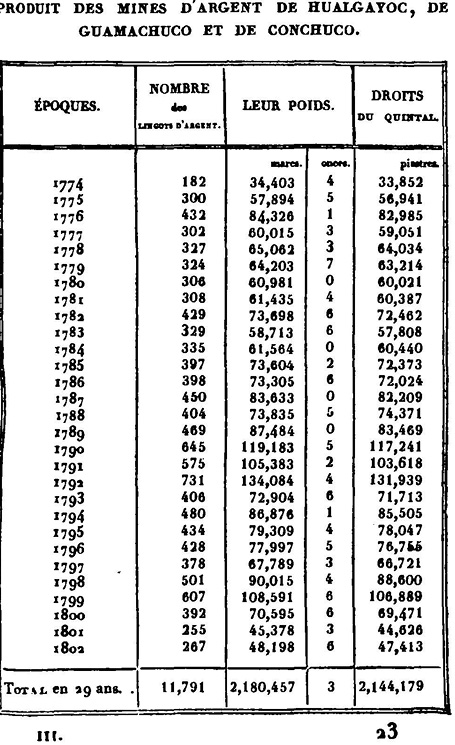
Figure 9a: Statistical table (NE III.353).
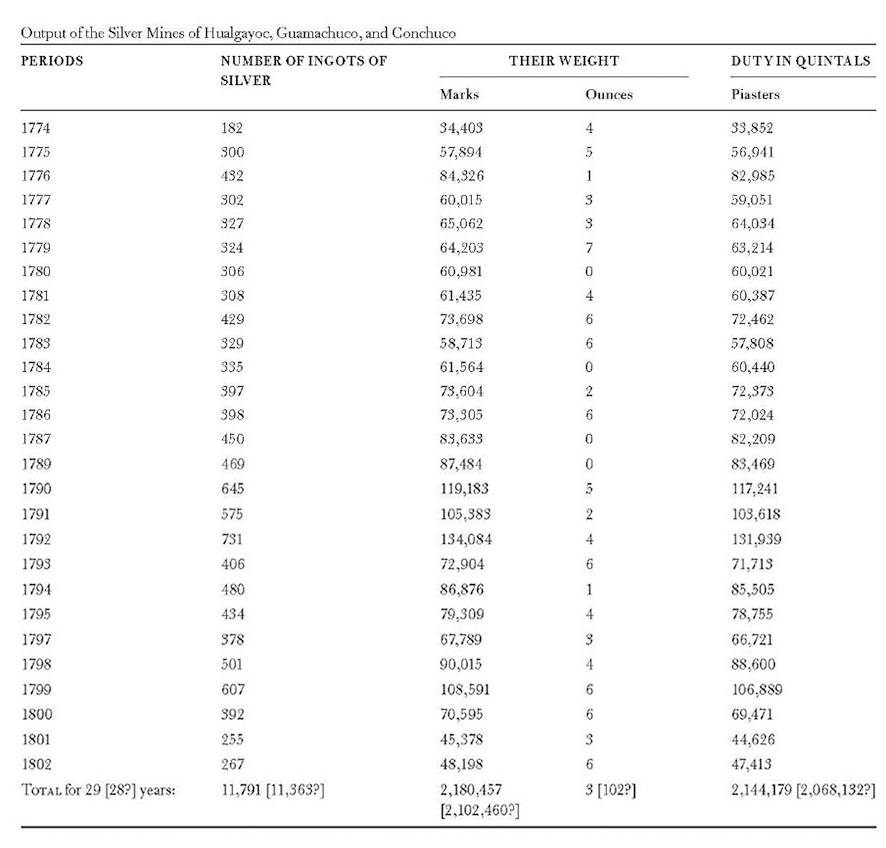
Figure 9b: English version (NS II.204–05).
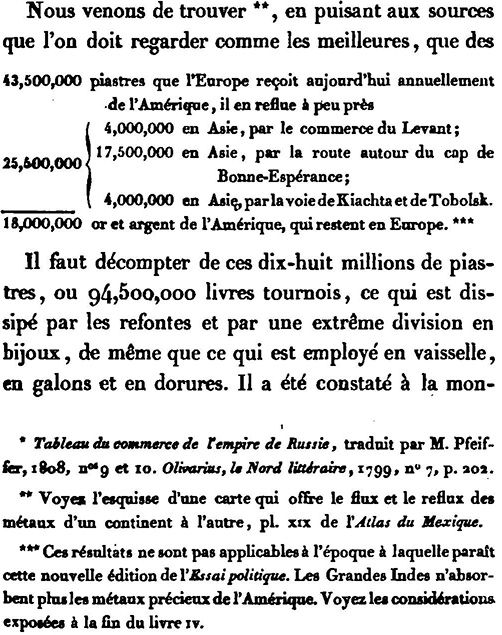
Figure 10a: Table (NE III.443).
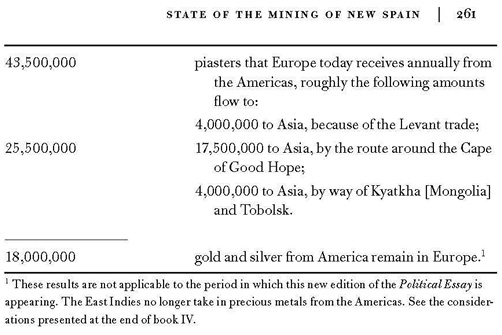
Figure 10b: English version (NS II.216).
In the translation, this table follows the conventions of statistical tables: Humboldt’s large bracket has been removed, the two columns lined up. Instead of merging with the surrounding narrative, the two are completely separate here due to framing lines at the top and the bottom. These image-text boundaries appear in every single table in New Spain; they are visible in Figure 9b as well. Such systematic separations amount to standardizations that render Humboldt’s crosswriting invisible and simplify the relations between table and narrative. Visually, the treatment of tables in the English version does not convey that Humboldt’s tables strain against standardization and regularization. Quite the opposite. There is no sense that Humboldt’s tables frequently spill across image-text boundaries.
The fact that the tables in Nouvelle Espagne have a far greater visual complexity and variety than they do in the translation also affects the reading process, because irregularities attract our attention visually, whereas rigid, repeated shapes suggest the kind of familiarity that makes us more inclined to skip over tables as if they were mere illustrations. The assumption, which grows stronger with each visual iteration of the same formal conventions, is that tables have little to add to our understanding. In this way, growing familiarity breeds if not contempt then certainly inattentiveness and a lack of (visual) engagement. At stake for Humboldt in resisting visual standardization and narrative linearity in his published and unpublished writing alike is not just to rupture linearity and produce an anti-chrononormative text. It is also, most significantly, to break the dominance of a single conceptual frame. To emphasize that Humboldt eschewed epistemic systems, along with the hierarchies they produce,23 does not, however, mean that he was not a methodical thinker and writer – but one who was able to create and negotiate the ceaseless interplay of different systems and methods.
I hope to have shown how engaging with the visuality of tables in Nouvelle Espagne and elsewhere in Humboldt’s writings can offer valuable insights into how Humboldt thought about the complex and rather messy relations between images and writing. Displacing tables and other images in Humboldt’s writing does more than create incoherence in the larger narrative: it also makes us lose sight of how Humboldt organizes his thoughts and puts them down on paper. If we – and here I can only speak about those who read Humboldt in a European language – engage seriously with the visual cues in a Humboldt text, we experience it as a challenge to the ideological presets that affect our ability to understand and imagine multidimensionality and multiconnectedness. When the process of reading becomes an off-road adventure, our imagination and our spirit can move in pursuit of the pleasures of forms of understanding that always reach beyond ourselves.
Campe, Rüdiger. The Game of Probability: Literature and Calculation from Pascal to Kleist. Translated by Ellwood H. Wiggins. Stanford, CA: Stanford University Press, 2012.
Crain, Caleb. “Further and Farther: A Theory.” New Yorker, October 23, 2015. https://www.newyorker.com/books/page-turner/further-and-farther-a-theory (accessed 10/03/23).
Dettelbach, Michael. “Describing the Nation: Local and Universal in Humboldt’s Administrative Practice and in Late Eighteenth-Century Cameralism.” In Alexander von Humboldt and the Americas, 183–208. Ed. Vera M. Kutzinski et al. Berlin: Edition tranvía, 2012.
Duncan, Ian. “Natural Histories of Form: Charles Darwin’s Aesthetic Science.” Representations (2020) 151 (1): 51–73. Doi: https://doi.org/10.1525/rep.2020.151.3.51.
Ette, Ottmar. Weltbewußtsein: Alexander von Humboldt und das unvollendete Projekt einer anderen Moderne. Weilerswist-Metternich: Velbrück Wissenschaft, 2002.
Ette, Ottmar, and Julia Maier, eds. Alexander von Humboldt: The Complete Drawings from the American Travel Diaries. Translated by Vera M. Kutzinski. Munich, London, New York: Prestel/Random House, 2018.
Godlewska, Anne Marie Claire. “Von der Vision der Aufklärung zur modernen Wissenschaft: Humboldt’s visuelles Denken.” In Ansichten Amerikas: Neuere Studien zu Alexander von Humboldt, 157–194. Ottmar Ette and Walther L. Bernecker, eds. Frankfurt am Main und Madrid: Vervuert, 2001.
Gómez-Gutiérrez, Alberto. “Alexander von Humboldt in the Correspondence of Sir James Edward Smith.” The Linnean 32.1 (2016): 17–22.
Humboldt, Alexandre de. Essai politique sur le royaume de la Nouvelle-Espagne. Paris: Schoell, 1808–1811.
—. Atlas géographique et physique du royaume de la Nouvelle-Espagne, fondé sur des observations astronomiques, des mesures trigonométriques et des nivellemens barométriques. Paris: Chez F. Schoell, 1811. David Rumsey Collection of Maps: https://www.davidrumsey.com/luna/servlet/view/search?q=pub_title=Atlas%20Geographique%20Et%20Physique%20Du%20Royaume%20De%20La%20Nouvelle-Espagne,%20Fonde%20Sur%20Des%20Observations%20Astronomiques,%20Des%20Mesures%20Trigonometriques%20Et%20Des%20Nivellemens%20Barometriques.%20Par%20Al.%20De%20Humboldt.%20Paris,%20Chez%20F.%20Schoell,%20Rue%20Des%20Fosses-Saint-Germain-L%27Auxerrois,%20No.%2029.%201811.%20De%20L%27Imprimerie%20De%20J.H.%20Stone.%20LIMIT:RUMSEY~8~1&sort=Pub_List_No_InitialSort,Pub_Date,Pub_List_No,Series_No (accessed 3/12/24).
—. Essai politique sur le royaume de la Nouvelle Espagne. Paris: Deuxième Ed. Antoine Augustin Renouard, 1825–27.
—. Essai politique sur l’Isle de Cuba. Paris: Gide Fils, 1826.
—. Essai sur la géographie des plantes, accompagne d’un tableau physique des régions équinoxiales, […] par Al. Humboldt et A. Bonpland. Rédigé par Al. de Humboldt. Paris: Schoell; Tübingen: J.G. Cotta, 1807. www.gallica.bnf.fr/ark:/12148/bpt6k5516049k.texteImage.
—. Vues des Cordillères et monumens des peuples indigènes de l’Amérique. Paris: F. Schoell, 1810.
Humboldt, Alexander von. The American Travel Diaries. Staatsbibliothek Berlin. https://humboldt.staatsbibliothek-berlin.de.
—. Kosmos: Entwurf einer physischen Weltbeschreibung. Ed. Ottmar Ette and Oliver Lubrich. Frankfurt am Main: Eichborn Verlag, 2004.
Jackson, Stephen T., ed. Essay on the Geography of Plants. Alexander von Humboldt and Aimé Bonpland. Translated by Sylvie Romanowski. University of Chicago Press, 2009.
Klein, Ursula. “The Prussian Mining Official Alexander von Humboldt.” Annals of Science, 69:1 (2012): 27–68. https://doi.org/10.1080/00033790.2011.609071.
Kraft, Tobias. Figuren des Wissens bei Alexander von Humboldt. Essai, Tableau und Atlas im Amerikanischen Reisewerk. Amsterdam: De Gruyter, 2014.
Kutzinski, Vera M., and Ottmar Ette, eds. Alexander von Humboldt’s Political Essay on the Island of Cuba. A Critical Edition. Translated from the French by J. Bradford Anderson, Vera M. Kutzinski, and Anja Becker. Chicago: University of Chicago Press, 2011.
—. Alexander von Humboldt’s Views of the Cordilleras and the Monuments of the Indigenous Peoples of the New Continent. A Critical Edition. Translated from the French by John Ryan Poynter. University of Chicago Press, 2012.
—. Alexander von Humboldt’s Political Essay on the Kingdom of New Spain. A Critical Edition. Translated. from the French by John Ryan Poynter, Ken Berri, and Vera M. Kutzinski. University of Chicago Press, 2019.
Mitchell, W. J. T. Image Science: Iconology, Visual Culture, and Media Aesthetics. University of Chicago Press, 2015.
Moret, Pierre, et al. “Humboldt’s Tableau Physique Revisited.” PNAS, June 25, 2019. Doi: https://doi.org/10.1073/pnas.1904585116.
Romanowski, Sylvie. “Humboldt’s Pictorial Science: An Analysis of the Tableau physique des Andes et pays voisins.” In Essay on the Geography of Plants. Alexander von Humboldt and Aimé Bonpland: 157–97. Ed. Stephen T. Jackson.
1 I thank Carmen Götz and Anthony Reed for their willingness to read and comment on the drafts of this essay.
2 For a recent natural-scientific critique of Humboldt’s data collection in the “Tableau Physique,” see Moret et al. For analyses less focused on Humboldt’s data and their accuracy, see Romanowski and Kraft. The image itself is available for download at https://www.avhumboldt.de/?p=11781 (last accessed 3/12/24).
3 While I use the English versions of Humboldt’s titles throughout, my reference points are always the French editions, which I include in the List of Works Cited. My page references in the case of New Spain are to the second revised French edition (NE) and its recent English translation (NS).
4 In his Preface to the first edition of New Spain, Humboldt mentions that his “matériaux géographiques et statistiques s’accrurent trop pour en faire entrer les résultats dans la Relation historique” [statistical and geographical materials grew to the point that it became impossible to include their results in my Personal Narrative] (NE 1808: 11).
5 Ette’s reading of New Spain in the context of the visuality of Humboldt’s thinking focuses exclusively on the maps that appear in a separate volume (Weltbewußtsein, 136–45).
6 Humboldt’s tableaus are almost always elaborately hybrid combinations of text, numbers, lines, and drawings. Writing in French, he rarely distinguishes between “tableau” and (statistical) tables, which are often parts of larger tableaus. I will not follow Humboldt’s practice in this regard.
7 “J’ai pensé que si mon tableau pouvoit faire naître des rapprochements inattendus dans l’esprit de ceux qui étudierons les détails, il seroit susceptible en même temps de parler à l’imagination et de lui procurer une partie de ces jouissances que fait naître la contemplation d’une nature aussi majestueuse que bienfaisante. […] un tableau physique des régions équatoriales pourroit non-seulement intéresser ceux qui s’occupent des sciences physiques, mais encore exciter à cette étude des personnes qui ignorent combien des plaisirs sont attachés au développement de notre intelligence” (Humboldt 1807, 43–44).
8 Humboldt may well have been familiar with Defoe’s novel. He had first encountered Defoe at age 11 through Robinson Crusoe, translated into German in 1779 as Robinson der Jüngere by Humboldt’s tutor Joachim Heinrich Campe. See Gómez-Gutiérrez, 18.
9 “The figure of the tabella, of the quasi-pictorial placing-before-the-eyes, repeats the construction of its own graphic mode of appearance on the semantic level of the text. Writing itself is already infused with a nonliteral [and non-literary] graphism displayed in the relation between letters and numbers, which is also simultaneously inherent in both aspects of writing. The constellation of literal and transliteral graphism can be called the diagrammatics of writing. The table in the novel, as we then might say, restages the diagrammatics of its fundamental condition as a written text” (Campe, 220–21).
10 “II serait à désirer qu’un voyageur versé dans la pratique des observations, et muni d’un sextant …, d’un garde-temps, d’une lunette achromatique et d’un baromètre portatif …, pût parcourir en trois directions le nord du royaume de la Nouvelle-Espagne” (NE I.14; italics added).
11 “La distance de Mexico à Pueblo Viejo de Tampico est en ligne droite d’après ma Carte générale de la Nouvelle-Espagne (1804), que M. Bauza va bientôt remplacer par une autre beaucoup plus exacte, de soixante lieues marines (à 2854 toises); en ajoutant un quart pour les sinuosités des chemins, on trouve que chacune des 111 lieues de muletiers est égale à 1928 toises” (NE II.366; italics added).
12 In metrical measurements, the first comparison in the table would be 296.25 km vs. 370.3 km (1 toise equals 1.94 meters). Humboldt’s numbers for the detours reflect a bit more than ¼.
13 Although there is no etymological distinction between the two terms, I find the following differentiation useful: “A mathematician might say that further is referring to the increase of a vector, and farther to the increase of a distance. To say it in English rather than in math: farther refers to a greater distance, literal or metaphorical, from a shared measuring point. Further refers to a greater progress in a shared direction” (Crain).
14 There is some disagreement on the date in online sources. https://shannonselin.com/2016/11/panoramas-19th-century/.
15 Early twentieth-century Cinerama technology was based on the idea of three-dimensionality as a visual illusion. Blu-Ray discs are a later manifestation of the same principle.
16 See Humboldt on panoramas in Kosmos, 234.
17 “Quoique le but de cet ouvrage soit plutôt de décrire les richesses territoriales que la constitution géologique de la Nouvelle-Espagne, j’ai cru devoir joindre à l’Atlas mexicain quelque vues pittoresques Nº XVI et XVII, pour servir de supplément à la carte de la vallée (pl. III), et pour faire mieux sentir la beauté du site de la ville de Mexico” (NE I.160–61).
18 See also Kraft 151f., a discussion of visual literacy in connection with Humboldt’s “Tableau physique des Andes.”
19 Humboldt provides information about the table’s provenance – it had been “drawn up at my request in the offices of the intendancy” (“a été formé, à ma prière, dans les bureaux de l’intendance”) – and he calls attention to his archival work in Peru in 1802 in his explanation of why the table is incomplete: he “was unable to obtain the output of the Cerro de Gualgayoc from the discovery of these deposits in 1771 until 1774 […] since at that time, silver was sent to Lima, [and] the archives of Trujillo could not provide any information about this” (NS II.203). We may well ask why the revenue was sent to Lima instead of Trujillo at that time.
20 “Toutes les mines de Gualgayoc, dans le partido de Chota, ont fourni aux caisses provinciales de Truxillo, depuis le mois d’avril 1774 jusqu’au mois d’octobre 1802, la somme de 1,912,327 marcs d’argent, ou, année moyenne, 67,193 marcs” (NE III.353).
21 Having been a member of at least one border commission, Humboldt was amply familiar with the permeability of all sorts of boundaries, including political borders.
22 While we were able to catch and correct most errors produced in this way, some of them in rather suboptimal ways, there is still one page in the published text that suffers from this very problem. See NS II. 283–84 compared to NE III. 472.
23 Some have taken Humboldt’s Kosmos as evidence of his attachment to system thinking. See Duncan, who also, oddly, implies that Humboldt was influenced by Darwin in this respect (57).

Dieses Werk steht unter der Lizenz Creative Commons Namensnennung - Nicht-kommerziell 4.0 International.
HiN - Alexander von Humboldt im Netz wird herausgegeben von der Universität Potsdam und der Berlin-Brandenburgischen Akademie der Wissenschaften.
ISSN 1617-5239 (online)
ISSN 2568-3543 (print)